Grouping Tasks
The Group button lets you organize your data by a specific criterion (e.g., Status, Client Name, or Project Name) to make it easier to read and track your daily tasks.
Examples:
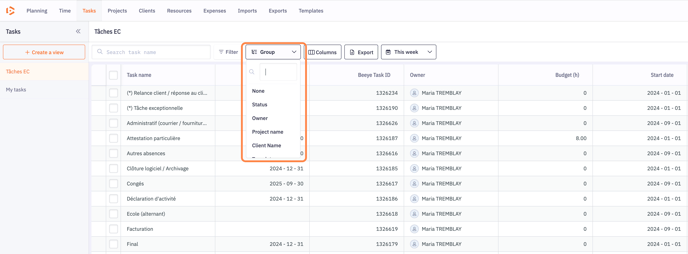
Group Tasks by Client Name
To quickly get a structured view of your tasks:
-
Go to the Tasks page.
-
Click on the Group dropdown at the top of the DataGrid.
-
Select Client Name, or another field, depending on how you want to group your data.
Tasks will automatically be grouped based on your selection, allowing you to view subsets of tasks and their totals by group.
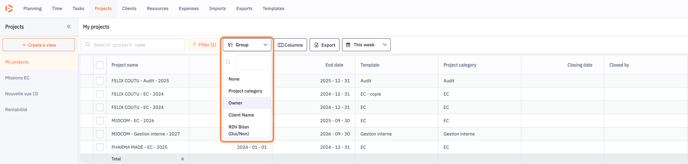
Group Projects by Category
-
Go to the Projects page.
-
Click on the Group dropdown.
-
Select Category.
The DataGrid will then display your projects grouped by category.
Collapse All Groups
To simplify the view and close all groups at once:
-
Click on the Collapse Groups button.
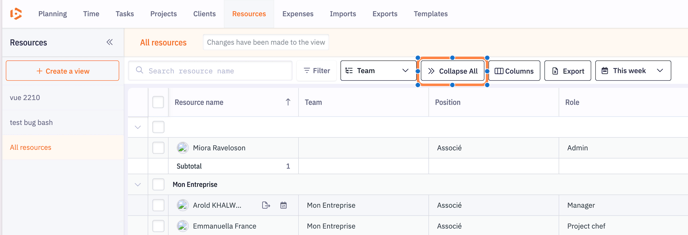
Tip: This button toggles between Collapse and Expand. For quick access, we recommend pinning it between the Group and Columns buttons.
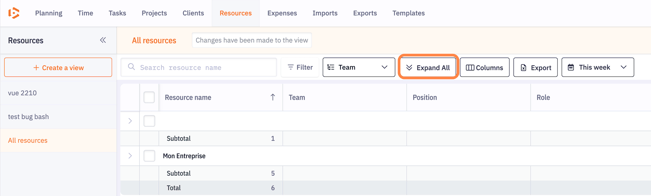
Expand All Groups
To quickly reopen all collapsed groups:
-
Click on the Expand Groups button.
This restores the display of all rows in each group.
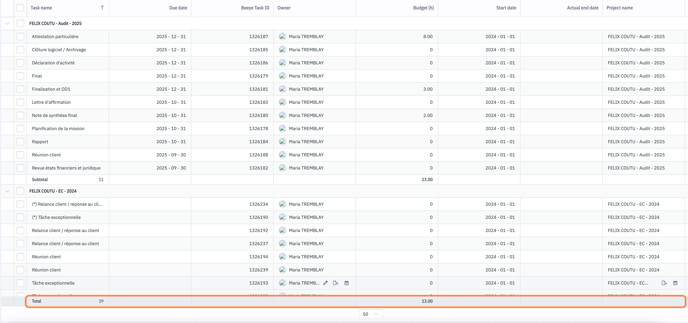
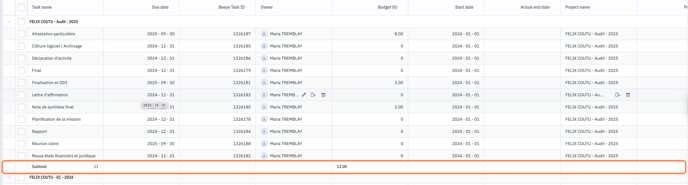
View Subtotals for Each Group
Subtotals summarize numeric data for each group (e.g., planned time, costs, etc.).
-
Select a grouping criterion from the Group menu (e.g., Client or Project).
-
The DataGrid will display rows grouped by this criterion.
-
Subtotals for each numeric column appear at the bottom of each group.
Subtotals make it easier to analyze key information without scrolling through every individual row.
View the grand total of all rows
The grand total allows you to see the sum of each column for all the data displayed in your DataGrid.
To view the grand total:
-
Scroll down to the bottom of the DataGrid.
-
The grand total row appears at the very bottom. It automatically shows the total number of items in the view (for example, the total number of tasks).